
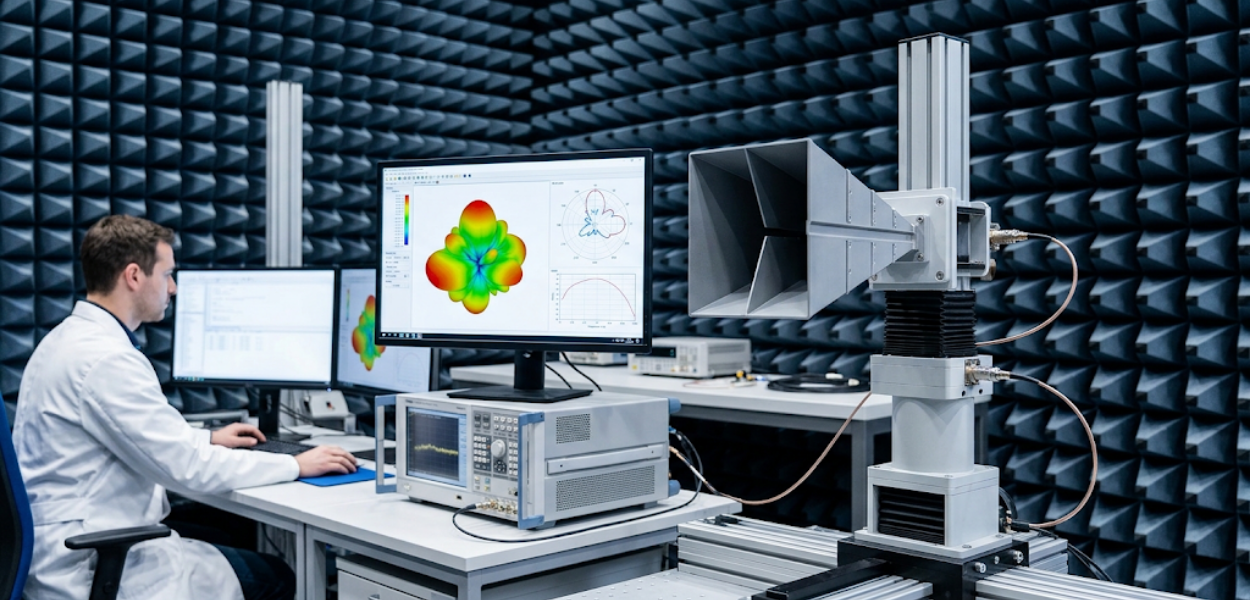
Antenna performance is confirmed in two places: the simulation software and the anechoic chamber. The two do not always agree. A design that models cleanly in CST or HFSS can still fail return loss targets once it sits on a real substrate, inside a real enclosure, fed by a real connector. The gap between predicted and measured performance is where projects lose weeks and budgets lose money.
Radiation pattern, gain, directivity, VSWR and return loss are the five parameters that decide whether an antenna design survives contact with measurement equipment. Engineers who understand how these parameters interact before the chamber booking avoid the costly cycle of redesign, re-simulation and re-test. Teams building this competency systematically, rather than learning it project by project, typically start with structured Antenna Design and Measurement Techniques Training Courses, which cover the simulation-to-measurement workflow before engineers touch chamber hardware.
This article breaks down the four fundamentals that determine antenna measurement accuracy: what a radiation pattern actually describes, how gain and directivity diverge, what VSWR and return loss confirm about impedance matching, and how microstrip patch geometry changes measured outcomes. It closes with the point at which simulation data stops being sufficient and physical verification becomes mandatory.
What Is a Radiation Pattern and Why Does It Define Antenna Performance?
A radiation pattern is a three-dimensional plot of how an antenna radiates energy across space, measured as field strength or power density at a fixed distance across all angles. It defines coverage, interference risk and link reliability before any other parameter is meaningful.
Radiation pattern data comes in two forms: a far-field pattern, taken at a distance where the wave behaves as a plane wave, and a near-field pattern, taken close to the antenna and mathematically transformed into far-field results. Far-field measurement is the industry standard for verifying design intent because it reflects how the antenna behaves in actual deployment.
A pattern has three defining features: the main lobe, which carries the majority of radiated power in the intended direction; side lobes, which radiate energy away from the intended direction and can cause interference; and the beamwidth, typically measured at the half-power point, which quantifies how narrow or wide the coverage is. A narrow beamwidth of 10 to 20 degrees suits point-to-point links. A wide beamwidth above 60 degrees suits broad-area coverage such as indoor Wi-Fi.
Pattern shape changes with frequency, substrate material and nearby metal structures. An antenna validated in isolation frequently shows a distorted pattern once mounted inside its final housing. This is why pattern measurement, not just simulation, remains a mandatory verification step rather than an optional confirmation.
How Do Gain and Directivity Differ in Antenna Specification?
Directivity measures how concentrated an antenna's radiation is in one direction relative to a theoretical isotropic radiator, while gain applies the same comparison but subtracts real-world losses from resistance, dielectric absorption and impedance mismatch. The two figures are frequently confused, and the confusion produces incorrect performance claims.
Directivity is a purely geometric calculation. It depends only on the shape of the radiation pattern and assumes a lossless antenna. A parabolic reflector with a narrow main lobe can show directivity above 30 dBi based on pattern shape alone. Gain takes that same geometric figure and reduces it by antenna efficiency, expressed as a percentage between 0 and 100. An antenna with 90 per cent efficiency and 10 dBi directivity delivers roughly 9.5 dBi gain.
The distinction matters commercially. A datasheet quoting directivity without stating efficiency overstates real-world performance. Procurement and engineering teams evaluating antenna suppliers need gain figures, measured under load, not directivity figures calculated in simulation. Gain measurement requires a calibrated reference antenna and a controlled test environment, because ambient reflections and cable loss both distort the reading.
For microstrip and printed antennas, efficiency losses of 20 to 40 per cent against simulated directivity are common, driven by dielectric loss in the substrate and conductor loss in thin copper traces. This gap is precisely why gain must be measured, not assumed.
What Do VSWR and Return Loss Reveal About Antenna Design Accuracy?
Voltage Standing Wave Ratio and return loss both quantify how much power reflects from the antenna instead of radiating, with VSWR expressed as a ratio and return loss expressed in decibels, and both derived from the same impedance mismatch. They are the first checkpoint in any measurement sequence, ahead of pattern and gain testing.
A perfectly matched antenna shows VSWR of 1:1 and return loss of negative infinity, meaning no reflection. In practice, a VSWR of 2:1 or below, equivalent to a return loss below negative 10 dB, is the accepted threshold for acceptable performance across most commercial and industrial applications. Above that threshold, reflected power degrades transmitter efficiency and can damage amplifier components over sustained use.
VSWR and return loss are measured with a vector network analyser connected directly to the antenna feed point, before any chamber testing begins. This sequencing matters. A mismatched antenna wastes chamber time, because pattern and gain readings taken through a mismatched feed carry systematic error that no post-processing corrects.
Mismatch commonly originates from three sources: incorrect feed line impedance, connector transitions that were not accounted for in simulation, and substrate dielectric constant tolerance that shifts resonant frequency away from the design target. Each source is identifiable through return loss sweep data before the antenna reaches expensive test facilities.
How Does Microstrip Patch Antenna Design Influence Measurement Results?
Microstrip patch antennas are compact, planar structures etched onto a dielectric substrate, and their measured performance is highly sensitive to substrate thickness, dielectric constant tolerance and feed point position, making them the antenna type most prone to simulation-to-measurement divergence. This sensitivity makes patch design a useful case study for the entire measurement discipline.
Patch antennas resonate at a frequency set by patch length relative to the substrate's effective dielectric constant. A dielectric constant tolerance of even 2 to 3 per cent, common in standard FR4 substrate, shifts resonant frequency enough to move the antenna outside its intended operating band. Simulation software using nominal dielectric values does not capture this batch-to-batch variation, which is why measured resonance frequently differs from simulated resonance by 1 to 3 per cent.
Feed point position controls impedance matching independently of resonant frequency. Moving the feed along the patch's resonant axis changes input impedance from near-zero ohms at the patch edge to over 200 ohms at the centre, with the standard 50-ohm match typically falling at an inset distance calculated from patch geometry. A feed position error of a few tenths of a millimetre, well within standard PCB manufacturing tolerance, produces a measurable VSWR shift.
Engineers working across simulation platforms, measurement automation and data post-processing for patch antenna characterisation rely on scripting and numerical tools to manage sweep data and correlate simulated results against measured results efficiently. Teams building or refreshing that computational capability alongside RF fundamentals often pair antenna training with Information Technology and Programming Courses to strengthen the data-handling skills that measurement work increasingly demands.
When Should Engineering Teams Move From Simulation to Anechoic Chamber Testing?
Teams should move to anechoic chamber testing once VSWR and return loss confirm impedance matching within specification, because chamber time is costly and pattern or gain measurement on a mismatched antenna produces unreliable data that must be repeated. The sequencing of verification steps is a resourcing decision, not only a technical one.
An anechoic chamber uses radio-absorbent material on every interior surface to eliminate reflections, isolating the antenna under test from environmental interference. Chamber bookings are typically charged by the hour and scheduled days or weeks in advance, particularly for calibrated facilities with certified reference antennas. Every hour spent troubleshooting a mismatch inside the chamber is an hour not spent on pattern and gain verification.
The practical sequence that avoids wasted bookings runs as follows: simulate the design and validate against target specifications, verify VSWR and return loss on a bench-mounted vector network analyser, confirm resonant frequency accuracy against simulation, and only then schedule chamber time for radiation pattern, gain and efficiency measurement. Skipping the bench verification step is the single most common cause of repeat chamber bookings across antenna development projects.
Organisations running multiple antenna projects concurrently face this cost multiplied across every design iteration. Getting the verification sequence right before committing to chamber time is the difference between one booking per design and three. Structured guidance on sequencing bench verification against chamber testing is covered in Get Antenna Design and Measurement Right Before It Costs You a Chamber Booking, which addresses the decision points engineering teams face once a design moves from simulation into physical test.
How Should Organisations Structure Antenna Design Verification Before Chamber Testing?
Organisations reduce measurement cost and rework by building internal verification checkpoints, standard test procedures and cross-trained engineering teams, rather than relying on chamber testing to catch design errors that bench measurement should catch first. This is a workforce capability question as much as a technical one.
Skill gaps in RF measurement typically show up in two places: engineers who can simulate accurately but cannot correlate simulation against bench data, and engineers who operate test equipment correctly but cannot interpret why measured results diverge from predicted ones. Closing both gaps requires training that connects simulation theory to hands-on measurement practice, not one or the other in isolation.
Explore More Expert Insights:
IP Protocols and Technologies: Encapsulation, MTU and Path Discovery Explained
Advanced Linux Admin: systemd Units, Namespaces and Kernel Tuning Explained
Organisations that invest in structured antenna measurement training report fewer repeat chamber bookings and shorter design-to-verification cycles, because engineers catch impedance and pattern issues at the bench stage. The return on that training investment is measured directly in chamber hours saved and project timelines held. For HR and learning teams building technical training plans, antenna measurement competency sits alongside broader RF and electronics skill development as a defined, measurable capability rather than an assumed one.